
AI's capability improvements haven't come from it getting less affordable
AI inference is still cheap relative to human labor

METR’s frontier time horizons are doubling every few months, providing substantial evidence that AI will soon be able to automate many tasks or even jobs. But per-task inference costs have also risen sharply, and automation requires AI labor to be affordable, not just possible.1 Many people look at the rising compute bills behind frontier models and conclude that automation will soon become unaffordable.
I think this misreads the data. The rise in inference cost reflects models completing longer tasks, not models becoming more expensive relative to the human labor they replace. Current frontier models complete tasks at their 50% reliability horizon for roughly 3% of human cost, and this hasn’t increased as capabilities have improved. So, cost isn't an additional bottleneck beyond capability, and we should expect to see automation at roughly the time predicted by METR's capability trendlines.
I define cost ratio as the inference cost of the average AI trajectory that solves a task divided by human cost to complete the same task. Using METR’s data, I examine the trend in cost ratios over time. I show three things:
Across successive frontier models, the cost ratio at each model’s 50% reliability time horizon hasn’t increased.
Among tasks models successfully complete, longer tasks don’t have higher cost ratios than shorter ones.
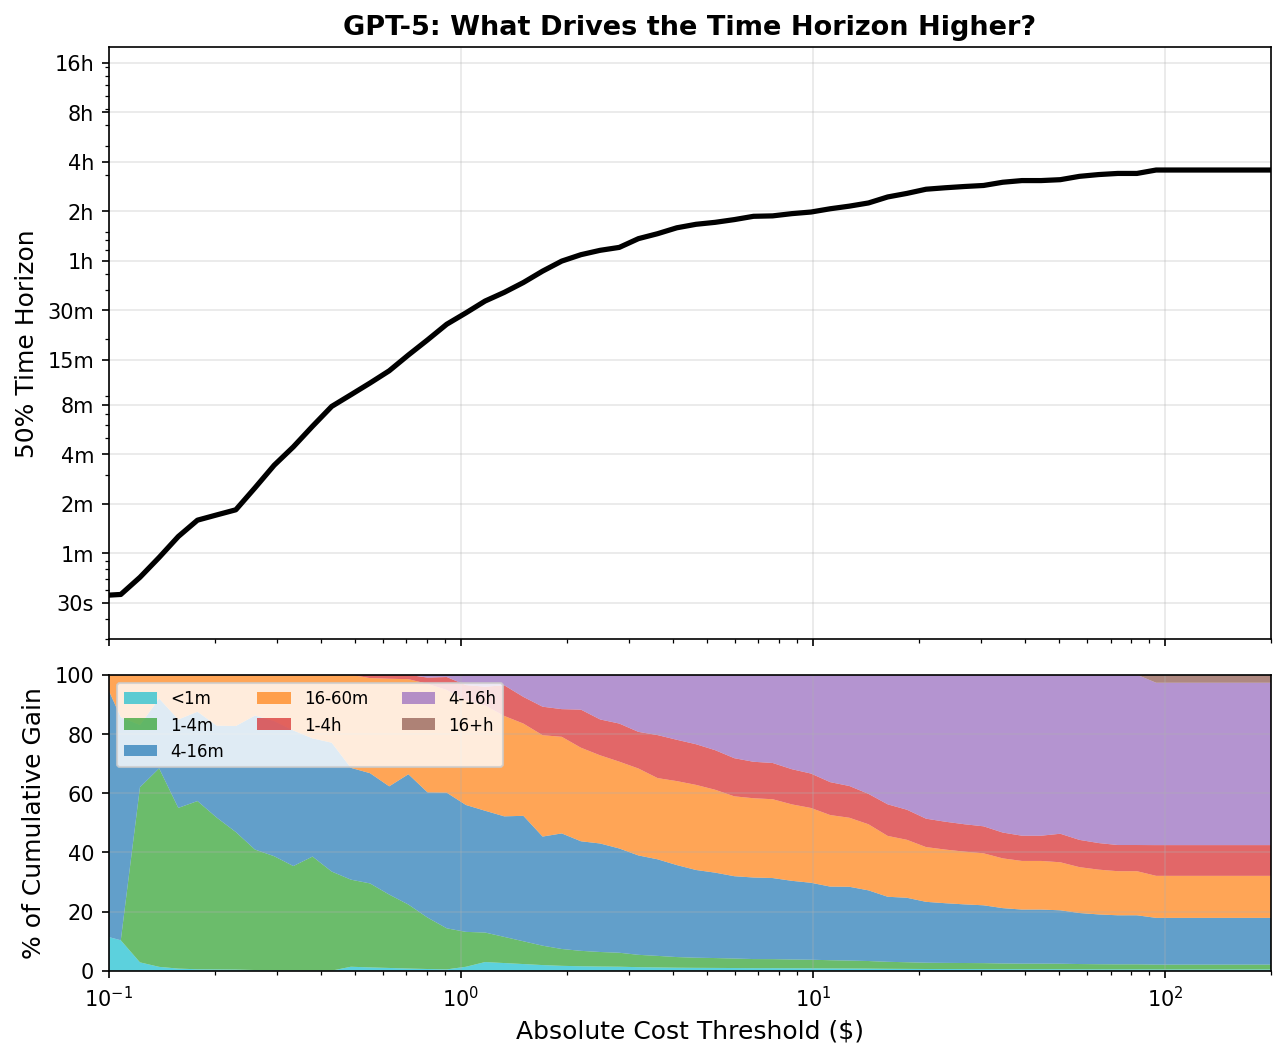
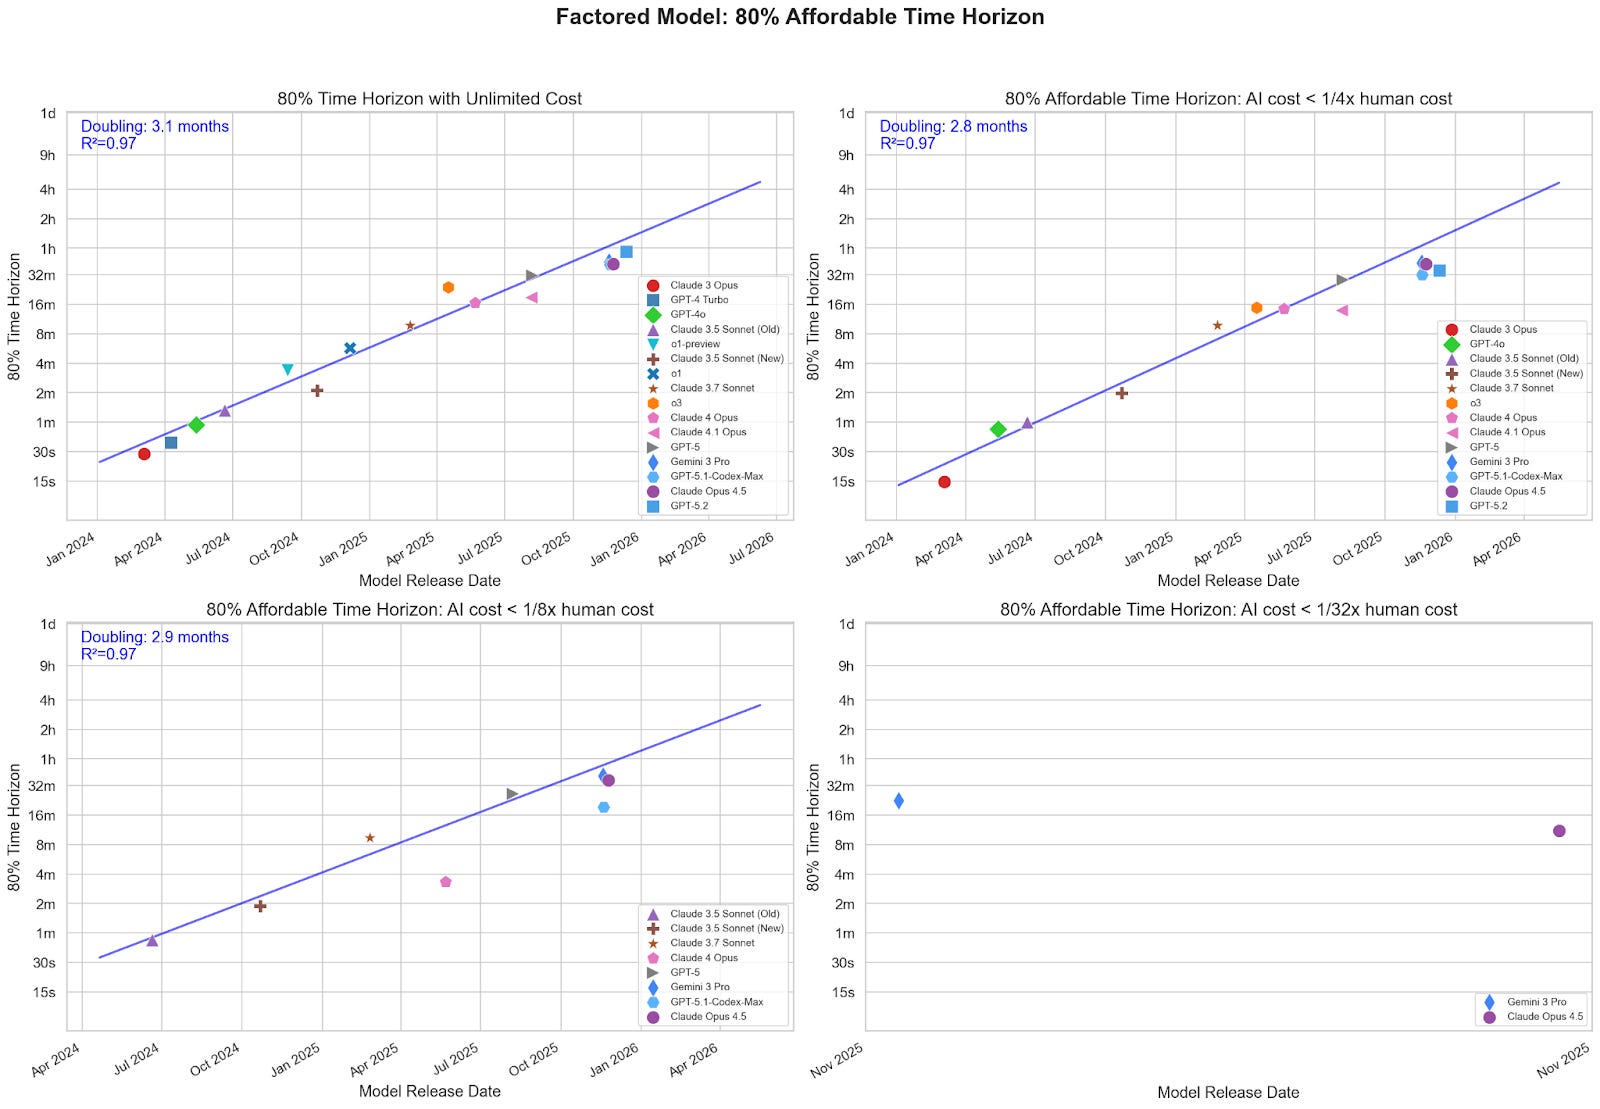
Time horizon trends barely slow when capping AI spending per task at a fraction of human cost (doubling every ~3 months, even at 1/32x).
Raising the cost ratio by providing additional compute might translate into longer time horizons, but that would be in addition to, rather than causing, current trends. So, compared to extrapolating METR’s data, increased inference-time spending will strictly shorten AI timelines.
In his article on this subject, Toby Ord came to the opposite conclusion; he argued that there is moderate evidence that “the hourly costs are rising exponentially” at the frontier of AI capabilities. In appendix A, I argue that the methodology Ord used to produce this conclusion is unreliable and leads to significant overestimates of hourly model cost.
Thanks to Toby Ord, Buck Shlegeris, Agustín Covarrubias, Alex Mallen, Alexa Pan, Tim Hua, Aniket Chakravorty, Arun Jose, and Francis Rhys Ward for helpful comments on earlier drafts. Thanks especially to Ryan Greenblatt for the ideas that inspired this article.
All figures in this article were generated with code that can be found here.
Evidence from METR
In this post, I analyze publicly available time horizon data from METR. I calculate cost ratio by estimating AI inference cost from token count (using OpenRouter pricing) and dividing by the human cost for each task provided by in the dataset. All calculations are performed using METR’s task weighting. I made some modeling assumptions to fill gaps in the METR dataset (see footnote).2 These assumptions shouldn’t affect my overall conclusions, because they shouldn’t significantly affect the trend across models.
My analysis has important limitations, which I discuss after presenting evidence.
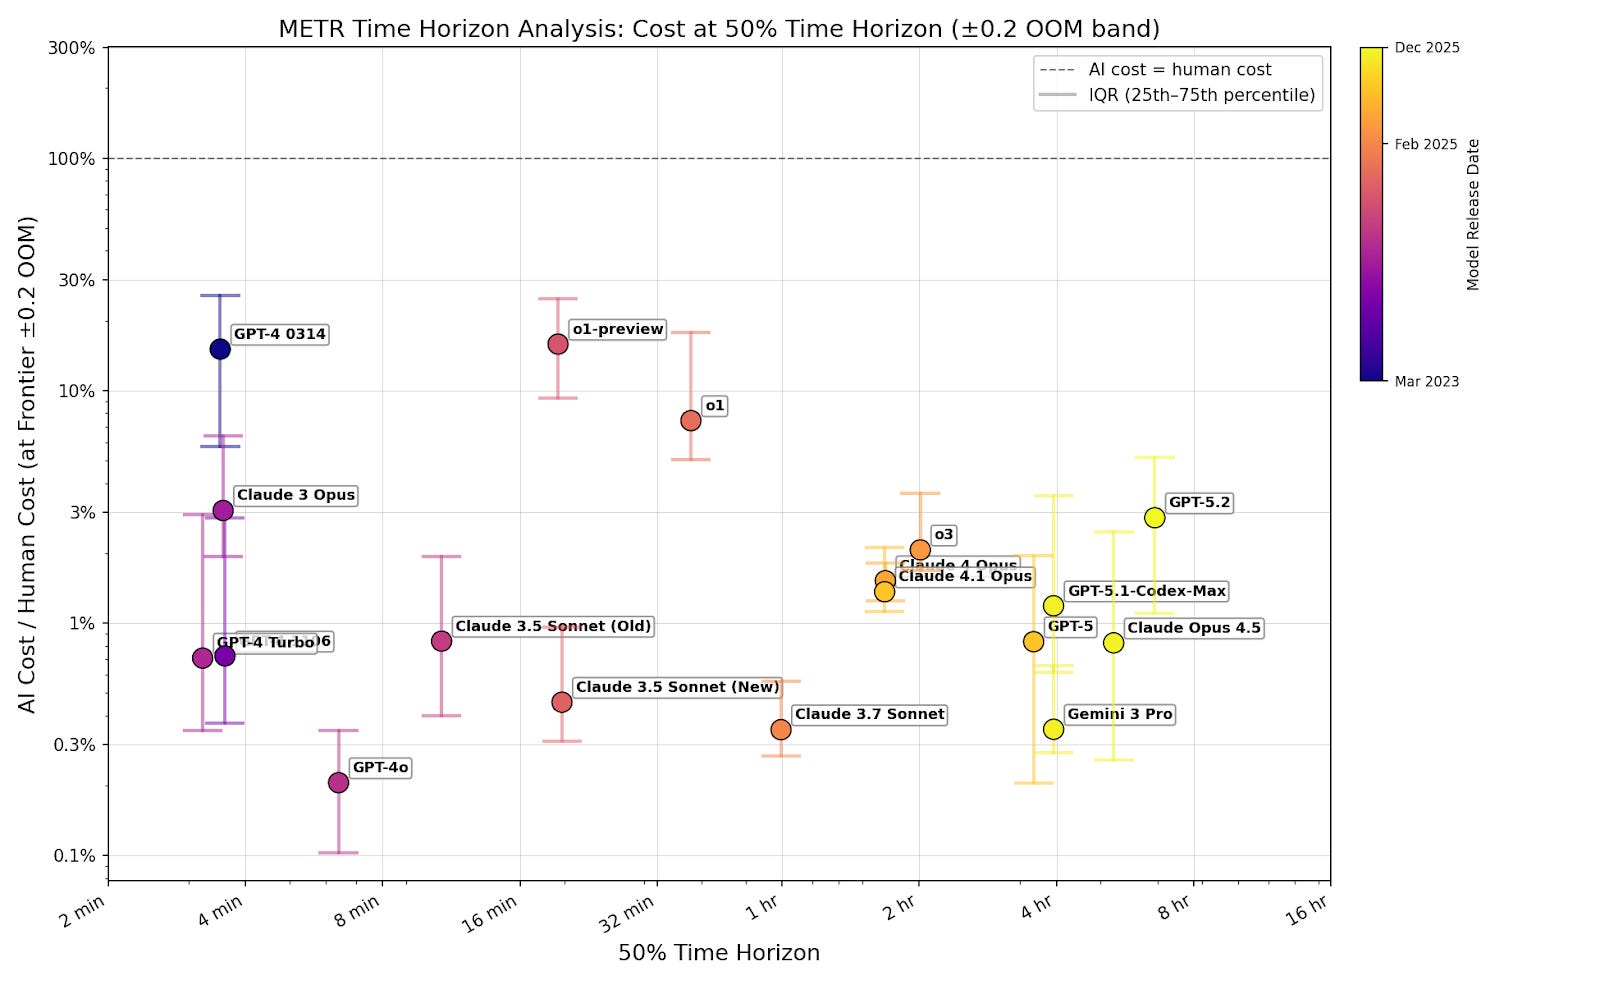
Cost ratio at models’ 50% time horizon isn’t increasing
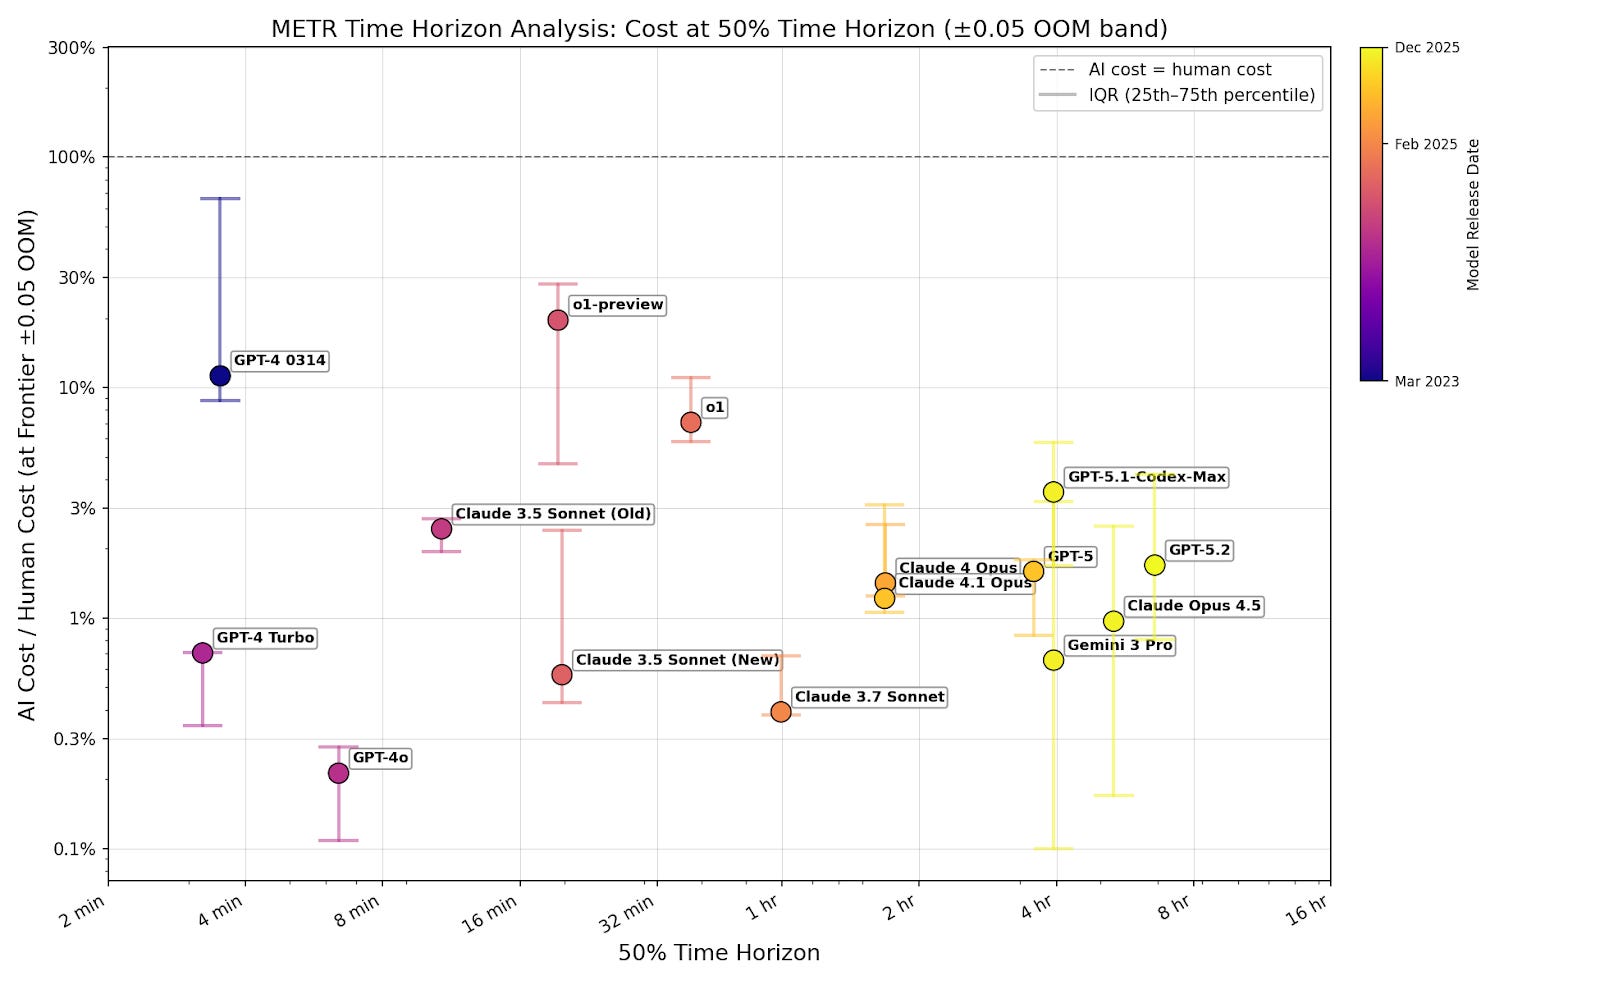
To investigate whether cost ratios rise as models improve, I examine the cost ratio at each model’s 50% reliability time horizon. For each model, I select tasks that the model successfully completes with lengths between 0.79 times and 1.29 times the calculated time horizon (which is plus or minus 0.1 orders of magnitude).3 I graph the median cost ratio in the selected set of tasks.
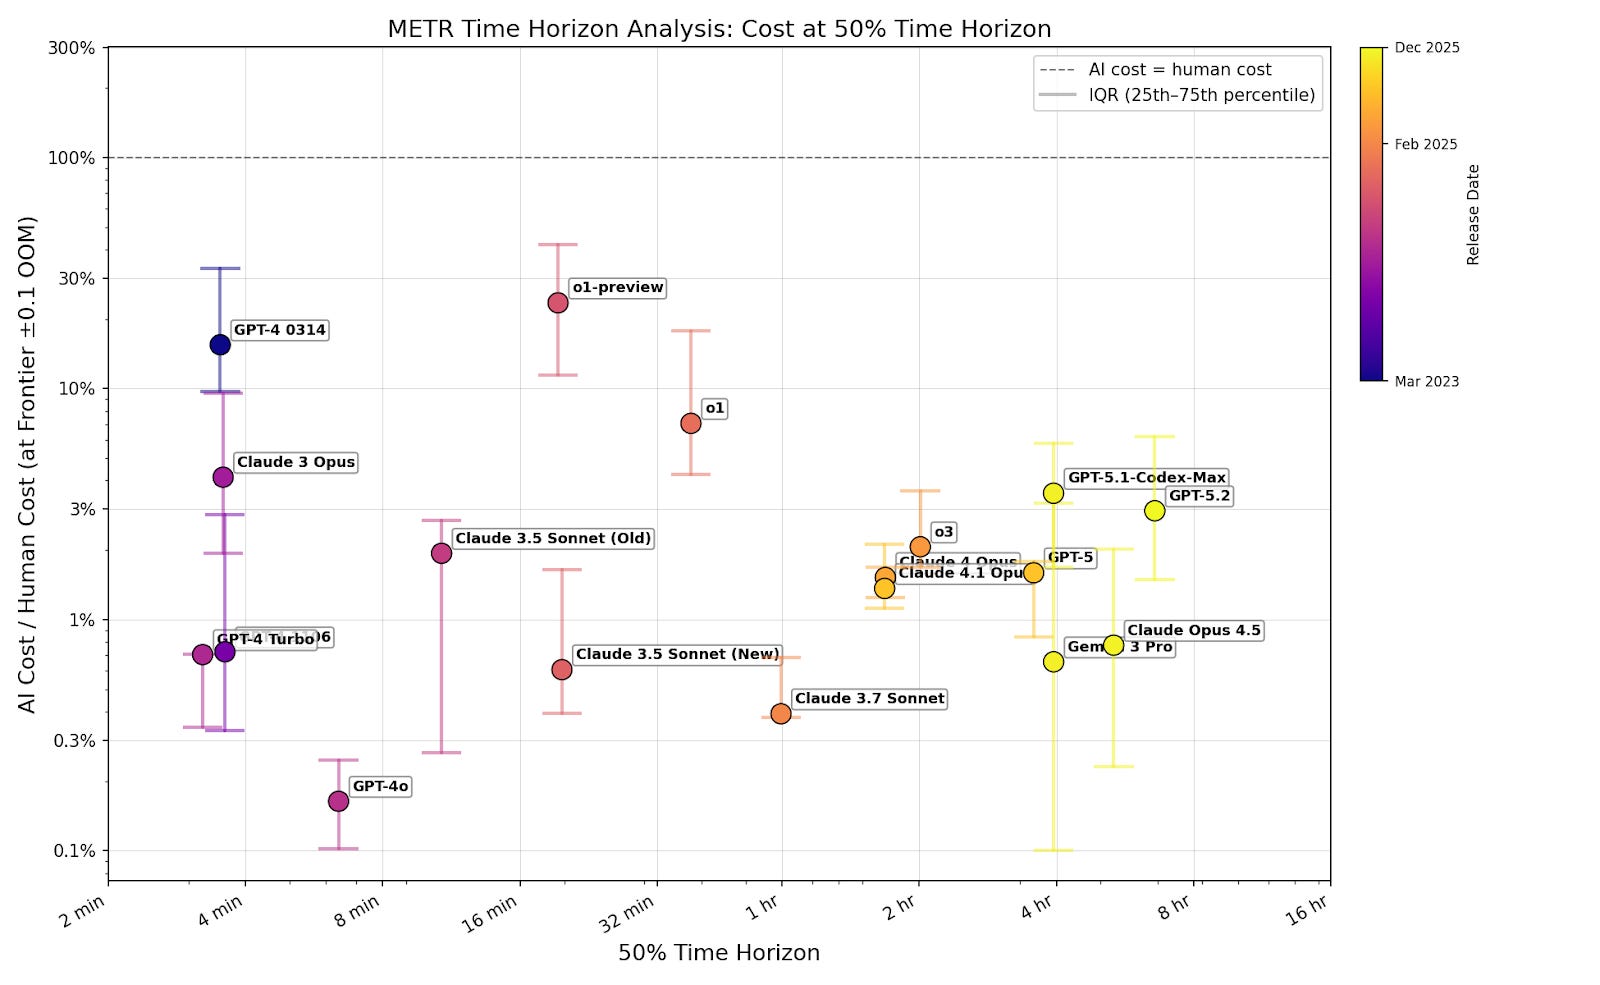
Cost ratios show no upward trend across models, and remain well below 1. As models’ 50% time horizon increases exponentially, companies can cheaply use them to complete longer tasks.
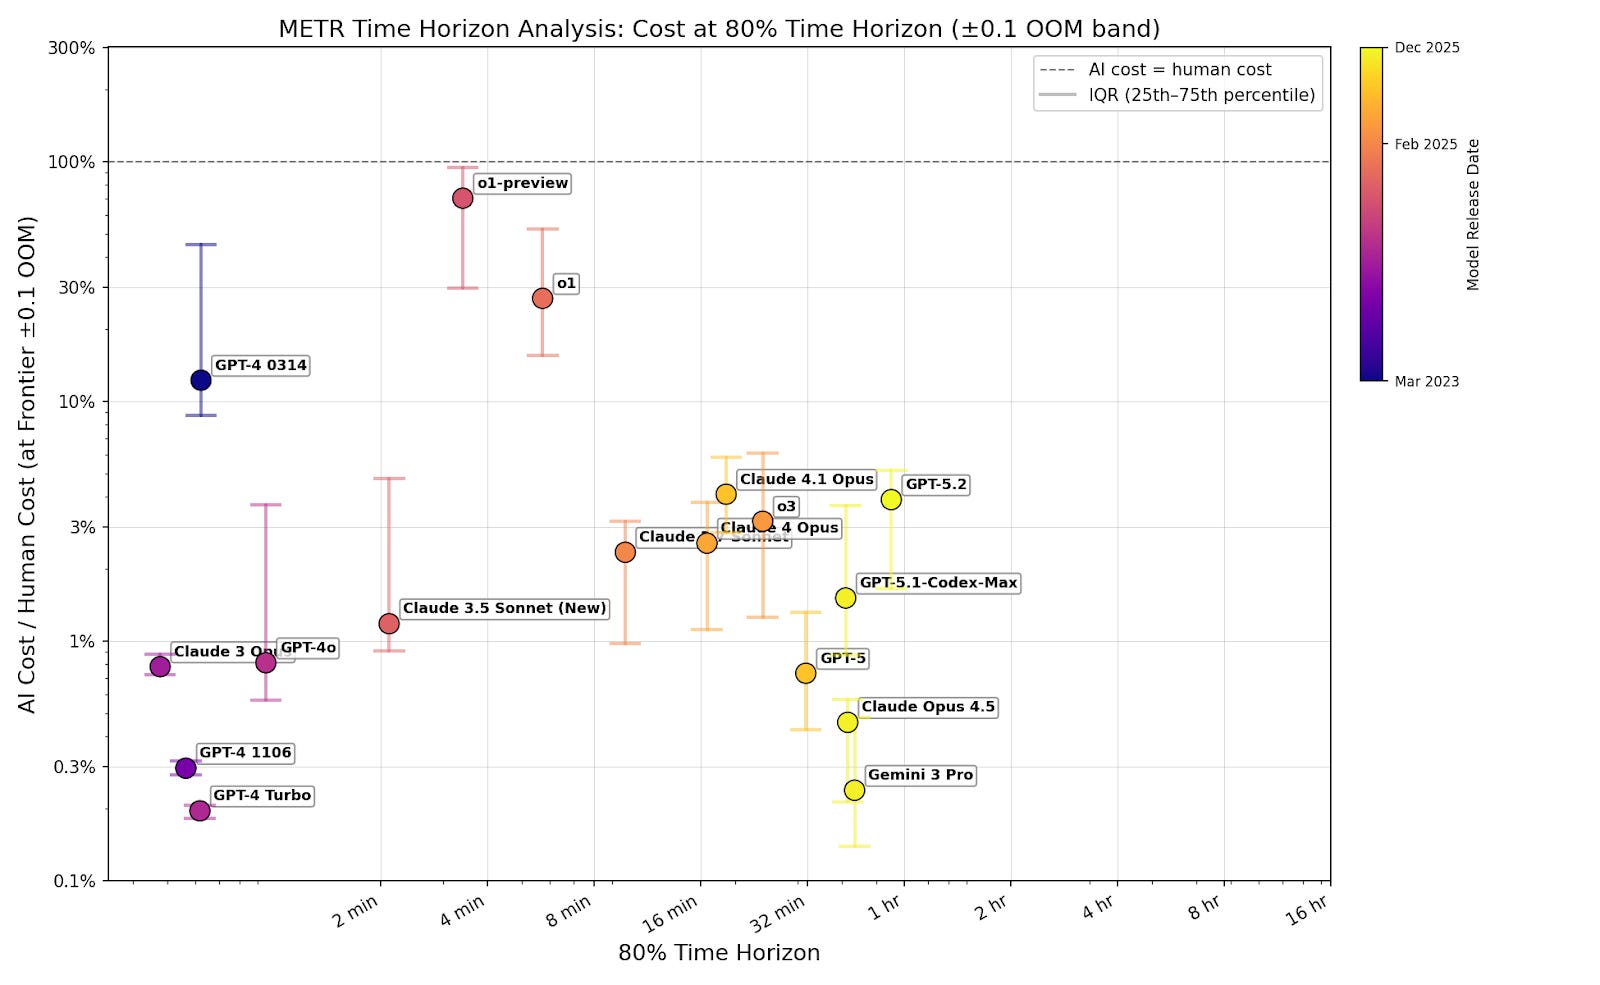
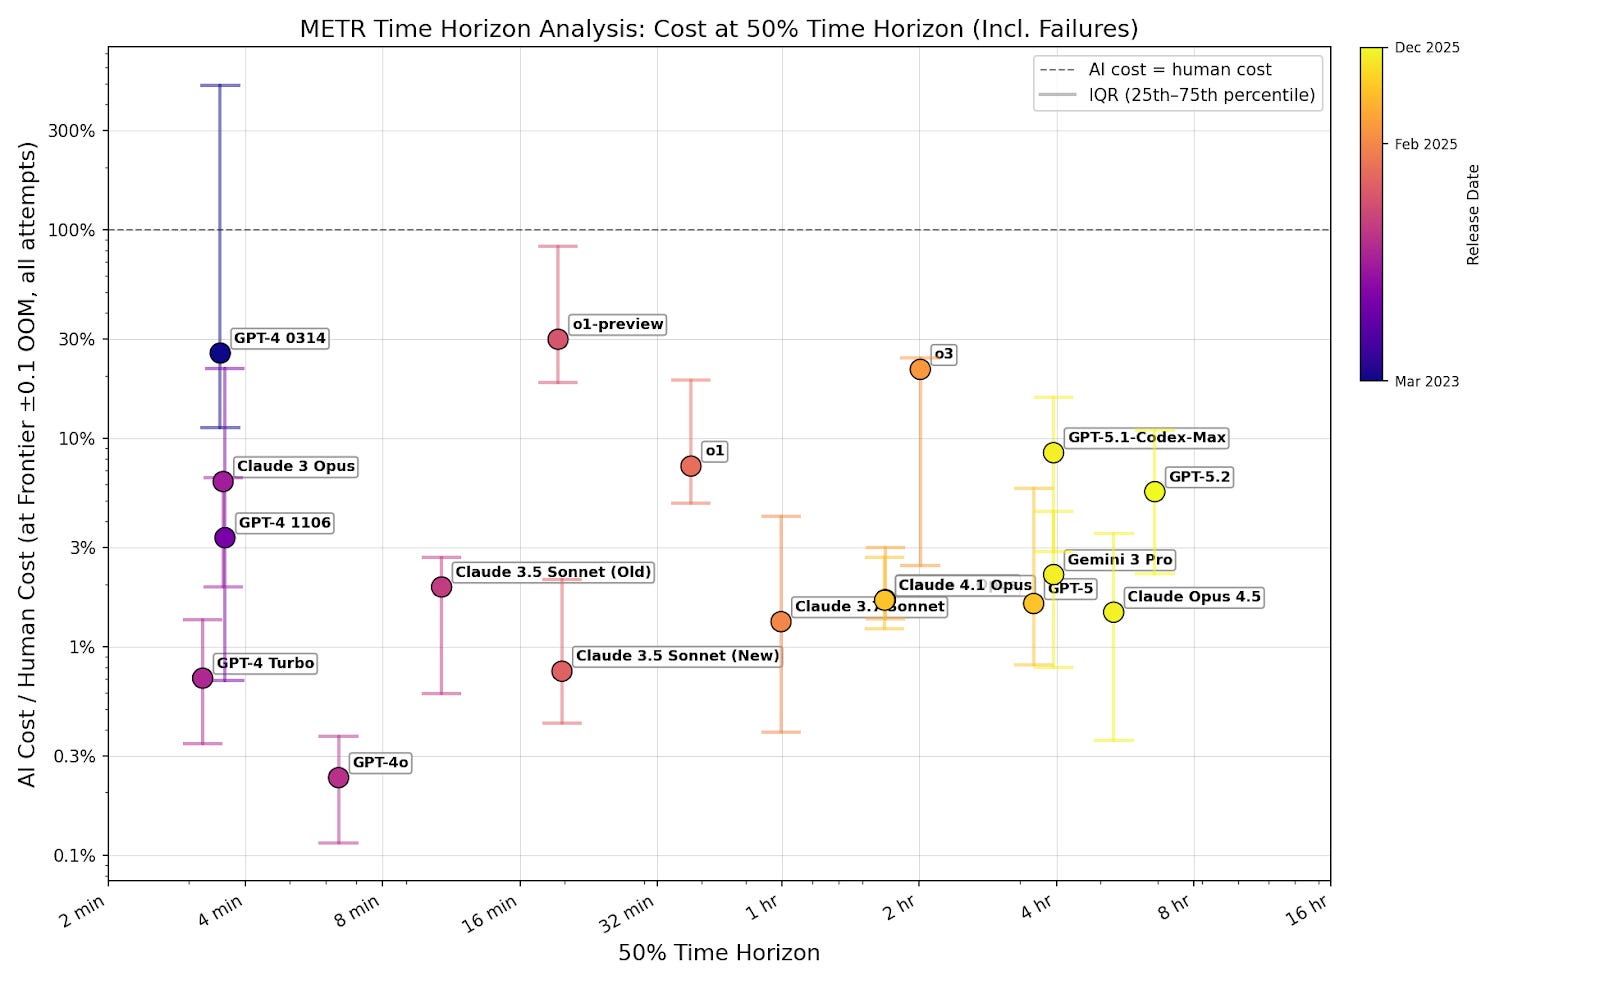
I filter for passing tasks to show that cost isn’t an additional limitation on top of capabilities. If successful tasks are cost-effective, then companies can set a low cost cap and still capture most successes. One might be concerned that this underestimates costs, because models tend to succeed at cheap tasks. But even at the 80% time horizon, where models complete the majority of tasks, cost ratios remain well below 1 (figure B3). Including failures doesn’t change this (figure B4).4 This means companies can profitably automate a broad share of tasks, not just a narrow cheap subset.
Time horizons improvements aren’t driven by expensive long tasks
One might respond to figure 1 by arguing that even if cost ratios at each model’s 50% time horizon aren’t increasing, improvements to those 50% time horizons come from successes on long tasks with high cost ratios. If this were true, we’d expect cost ratios to rise with task length among successfully completed tasks. I show that’s false: among successful tasks, cost ratios don’t rise with task length.5
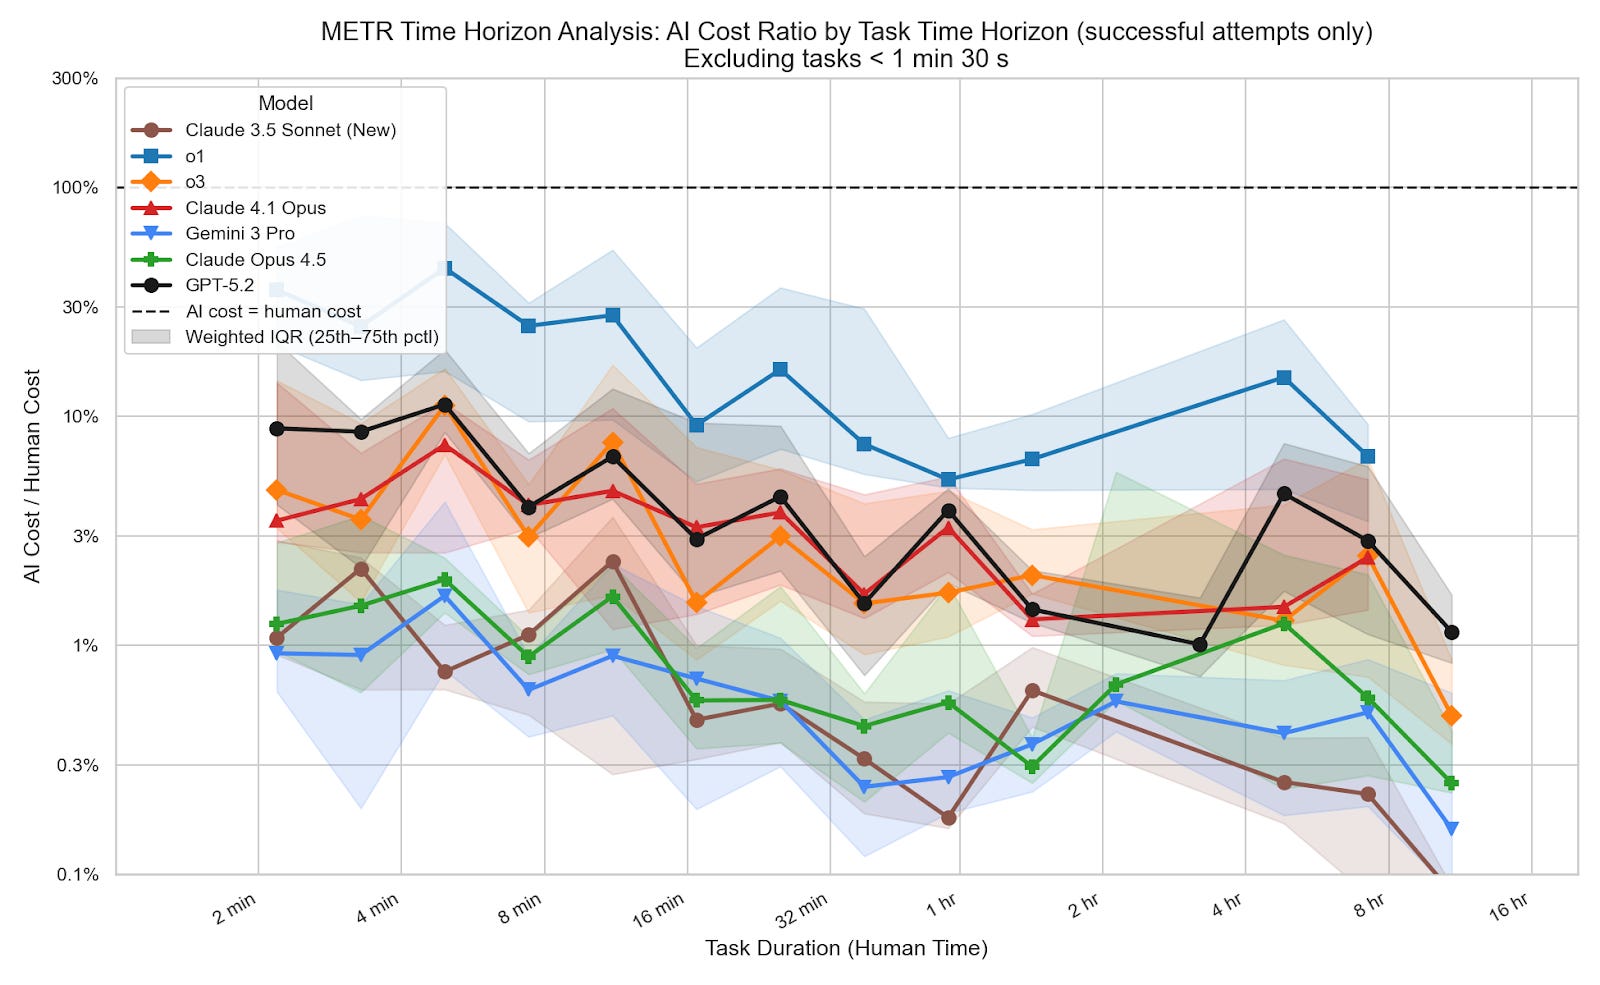
This doesn’t mean models are more efficient at longer tasks. There’s a strong selection effect here: models pass far fewer long-horizon tasks, and likely only succeed on those that happen to be relatively cheap. But since only successes push the time horizon forward, what matters is whether longer successful tasks are expensive, and the data shows they aren’t.
Progress at a fixed cost is just as fast
Another way to examine the affordability of AI progress is to ask how much progress slows if companies cap AI spending at a fraction of human cost.
I model the affordable 50% time horizon, the maximum task length at which models have a greater than 50% chance of both completing a task and doing so under a given cost ratio. If progress is fast at a low cost ratio, then we can expect that AIs will soon be able to cheaply complete long tasks. I test a range of caps, from 1/4x to 1/32x human cost, to see whether tighter budgets substantially slow the trend.
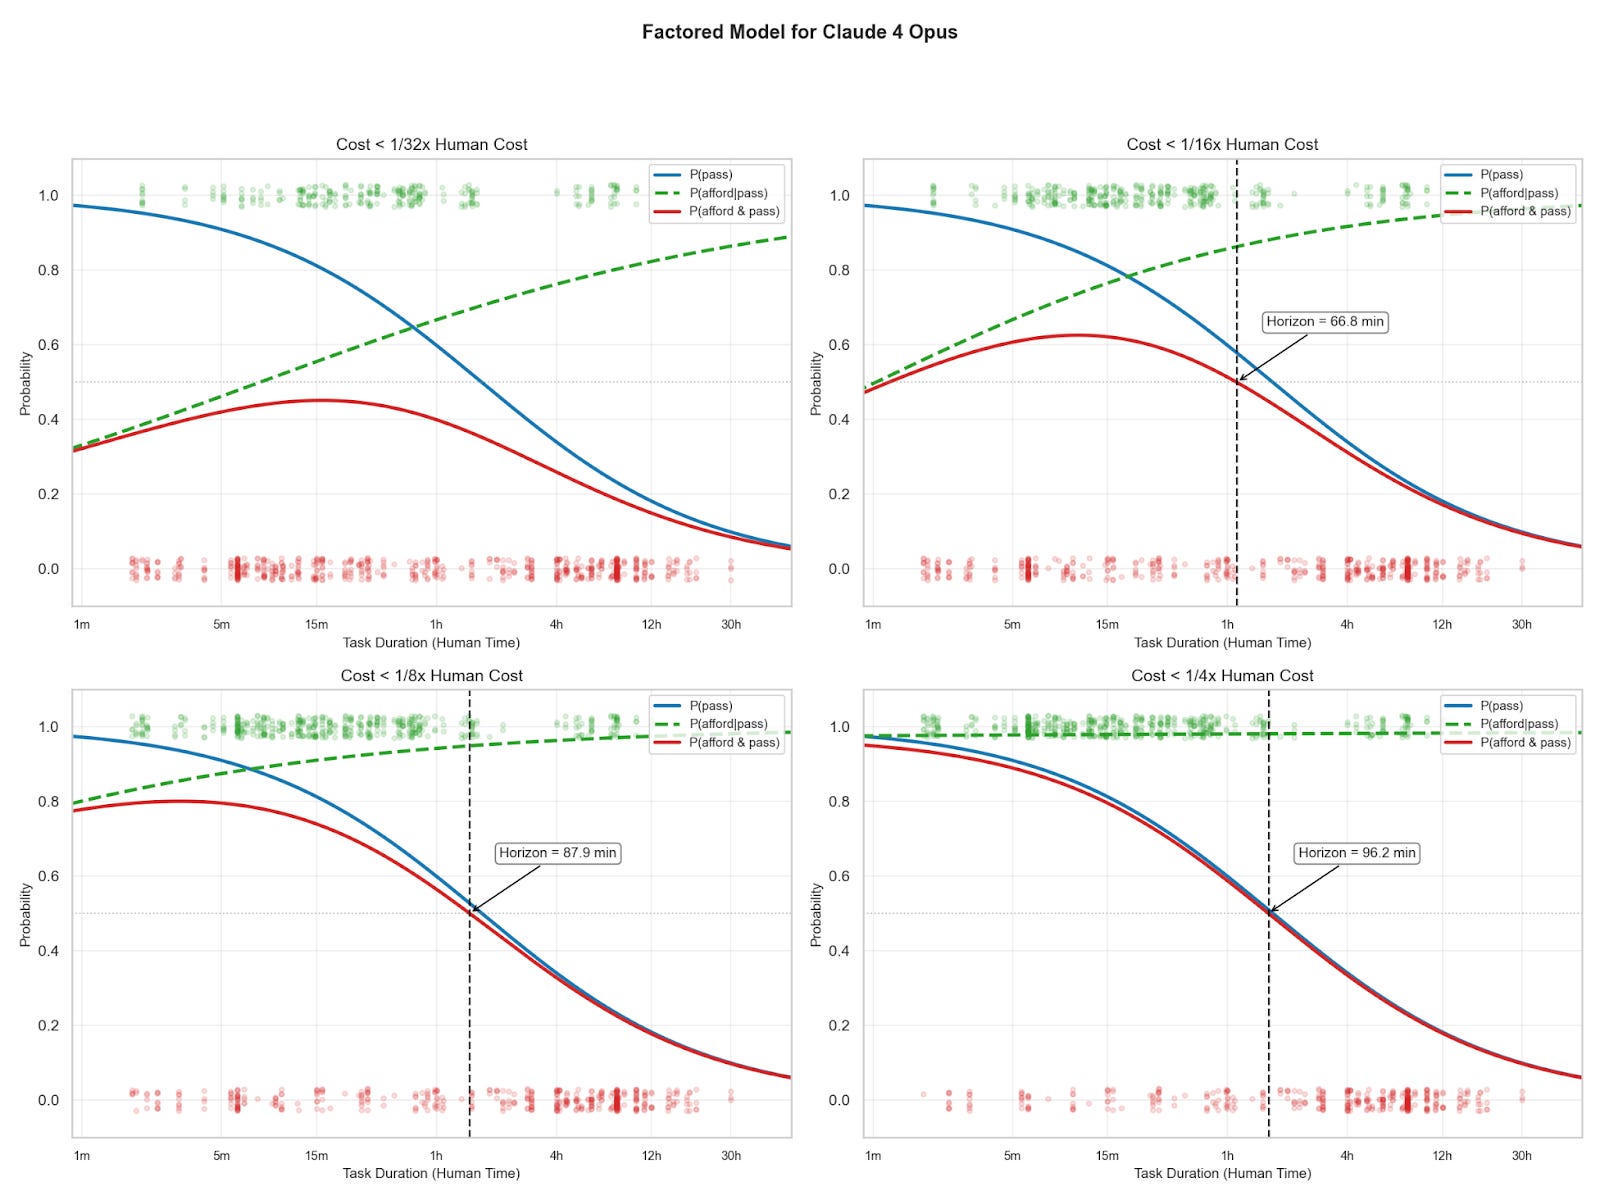
I model affordability and passing separately. I fit a logistic curve to the pass rate as a function of task length, and a separate logistic6 to the probability that any passing task is affordable. I do this because pass rate falls with task length, but affordability increases (see figure 2). Fitting a single logistic curve would fail to capture these opposing trends.
Multiplying the pass rate logistic and affordability logistic gives the probability that a task at some length will both pass and be affordable:
The affordable 50% time horizon is the longest task length at which p(pass & afford) is greater than or equal to 50%.
At different maximum cost ratios, the doubling times are reliably similar.
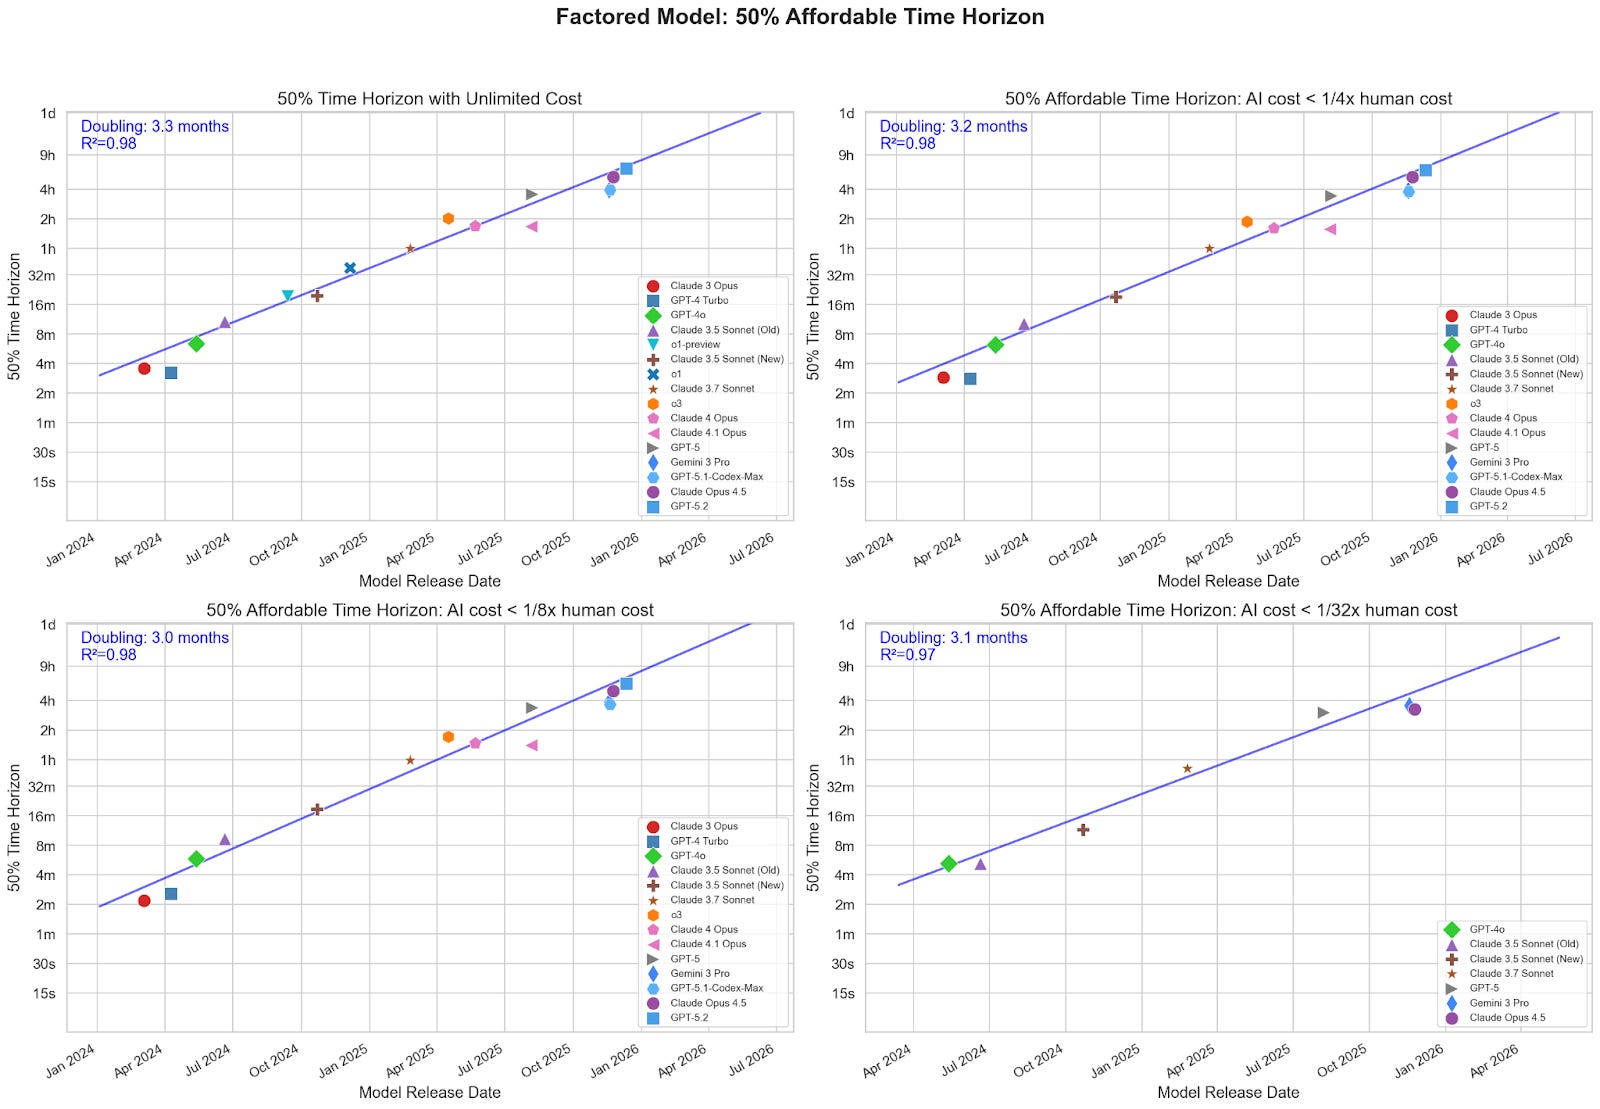
Stricter cost thresholds filter out some models, but enough recent models have cleared even the tightest thresholds to keep the doubling time around 3 months.
Limitations of my methodology
This data has some important weaknesses for the analysis I performed above:
AIs may disproportionately succeed on cheaper tasks at any given length, which would mean the cost ratios I observe reflect the cheapest subset rather than a representative workload. I minimize the effect this has on my results by focusing on trends in cost ratios rather than absolute levels, and by examining cost ratios at higher reliability thresholds where the selection effect is weakened.7
Models’ primary objective in these benchmarks is to complete tasks rather than minimize costs. My approach assumes these tasks were completed at the minimum cost, but some tasks may have been solvable at lower cost (e.g., with different prompting). As a result, I might significantly overestimate the costs of some tasks compared to scaffolding or prompting to optimize for cost.
METR notes that scaffolding differences make cost comparisons between models difficult. Unfortunately, I couldn’t find data that holds scaffolding fixed, so there isn’t an easy way to correct this. However, scaffolding differences would need to change costs by manyfold to produce a noticeable effect on the cost trend.
AIs might have advantages on benchmark tasks because of overfitting, which could drive down absolute costs. But this would only affect the trends I observe if overfitting disproportionately reduces costs at longer or shorter time horizons, and I see no reason to expect that.8
I think that these may mildly influence my results, but are unlikely to change overall trends.
Inference scaling will just make progress faster
If companies are willing to increase cost ratios (to 1, or even above), they might unlock even better capabilities. AI might be faster or higher quality than human labor in some domains, so the additional cost may be worthwhile.
UK AISI showed that newer models have larger gains from additional inference compute. In some domains, like ARC-AGI, performance improves a lot from large amounts of test-time compute, as demonstrated by o3’s performance at different cost thresholds and Ryan’s results . METR shows that additional token budget can improve a model’s 50% time horizon (note that this is an upper limit on per-task tokens, so not analogous to cost ratio), although with the Claude Code scaffold this is fairly limited.
Over time, we should expect the gains from additional inference compute to grow as models improve at using test-time compute. Already, AI providers offer increased test-time compute at a cost premium, like GPT-5.4 pro and extended thinking with Claude. As companies automate more labor, they might increasingly opt for these premium tiers over base models.
It’s not yet clear how much improvement is possible by increasing test-time spending, but given the relatively low cost necessary to achieve METR’s time horizons, substantial increases may be economically viable. Any gains would come on top of the trends observed by METR.
Conclusion
The data shows that observed increases in AI agentic capabilities have not come from rising cost ratios. METR’s trendlines predict the length of tasks AI can complete cheaply.
I think companies will be able to affordably deploy models to complete tasks at their 50% or 80% time horizons. At these horizons, many tasks will fail, but at ~3% cost ratio companies can cap spending per attempt well below human cost, retry identified failures, and still profitably automate. And, more speculatively, if companies can predict which tasks will succeed, they can selectively automate those.
In some domains, it might be possible to increase cost ratios to make AI agents much more capable, but this possibility strictly shortens timelines to any capability milestone, rather than lengthening them. The first AIs with human-level intelligence may cost more than human labor, but cheap human-level AIs should not be far behind.
Appendix A: Why I get different results from Ord
Toby Ord analyzed the same issue and found very different results. I think this is explained by how he calculated hourly cost, which leads to significant overestimates. I also explain more minor reasons to prefer my analysis to his at the end of this appendix.
Ord’s results come from his analysis of this graph, released by METR (with his annotations).
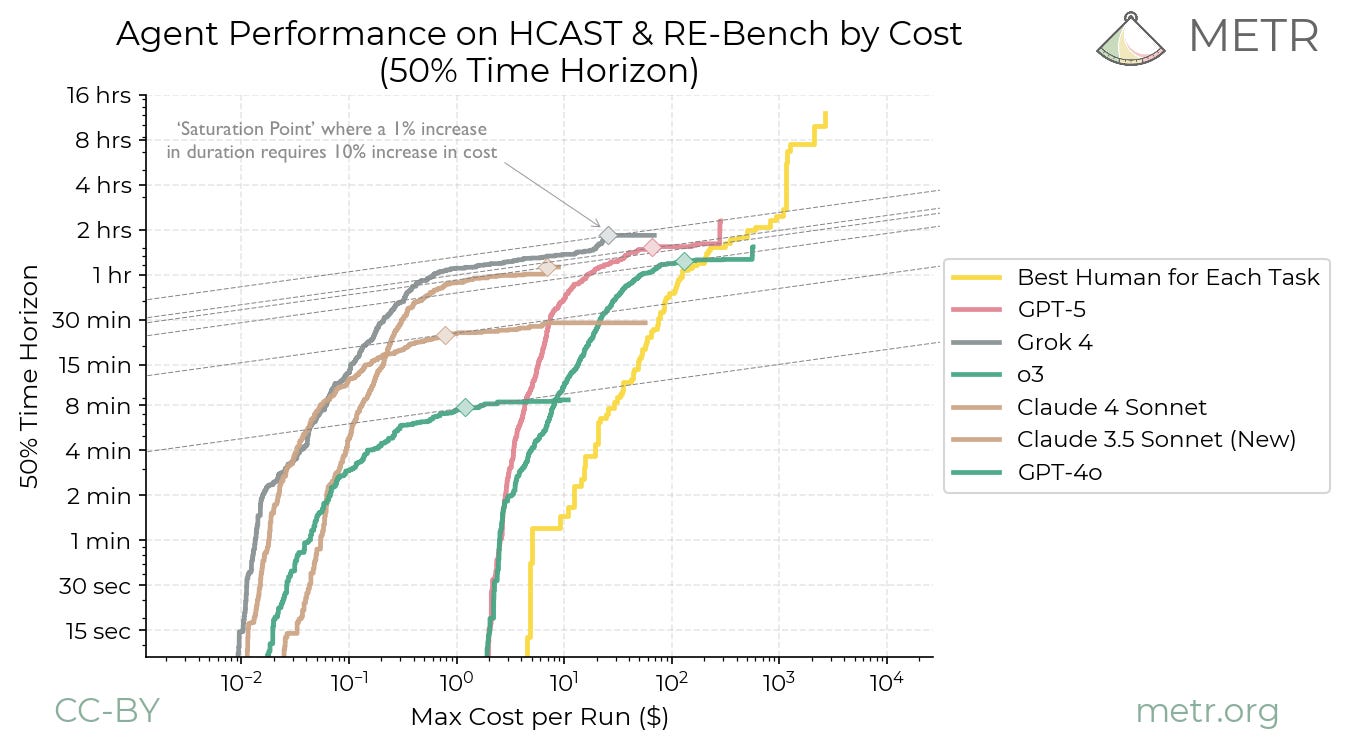
Ord uses this graph to find the hourly cost of AIs at their “saturation point” (where increasing the total budget doesn’t significantly increase the model’s 50% time horizon).
I don’t think Ord’s methodology calculates the real hourly AI cost for any set of tasks. Ord calculates hourly cost using the following method for the saturation point:
Where the per-task budget is the maximum that can be spent on any individual task.
For example, my data shows GPT-5 succeeds on 1-2 hour tasks at a median cost of $1.29, but Ord’s method requires a $10+ budget to reach a time horizon in that range. The reason is that the 50% time horizon at the saturation point is influenced by passing tasks significantly longer than the horizon itself (see figure A2). So the per-task budget must be large enough to pay for the most expensive task necessary to reach the saturation point, which has a high absolute cost even if its hourly cost is low. Dividing this inflated budget by the shorter 50% time horizon produces an inflated hourly cost. In effect, hourly cost is set by the price of passing a 4-hour task, divided by a 1.6-hour horizon.
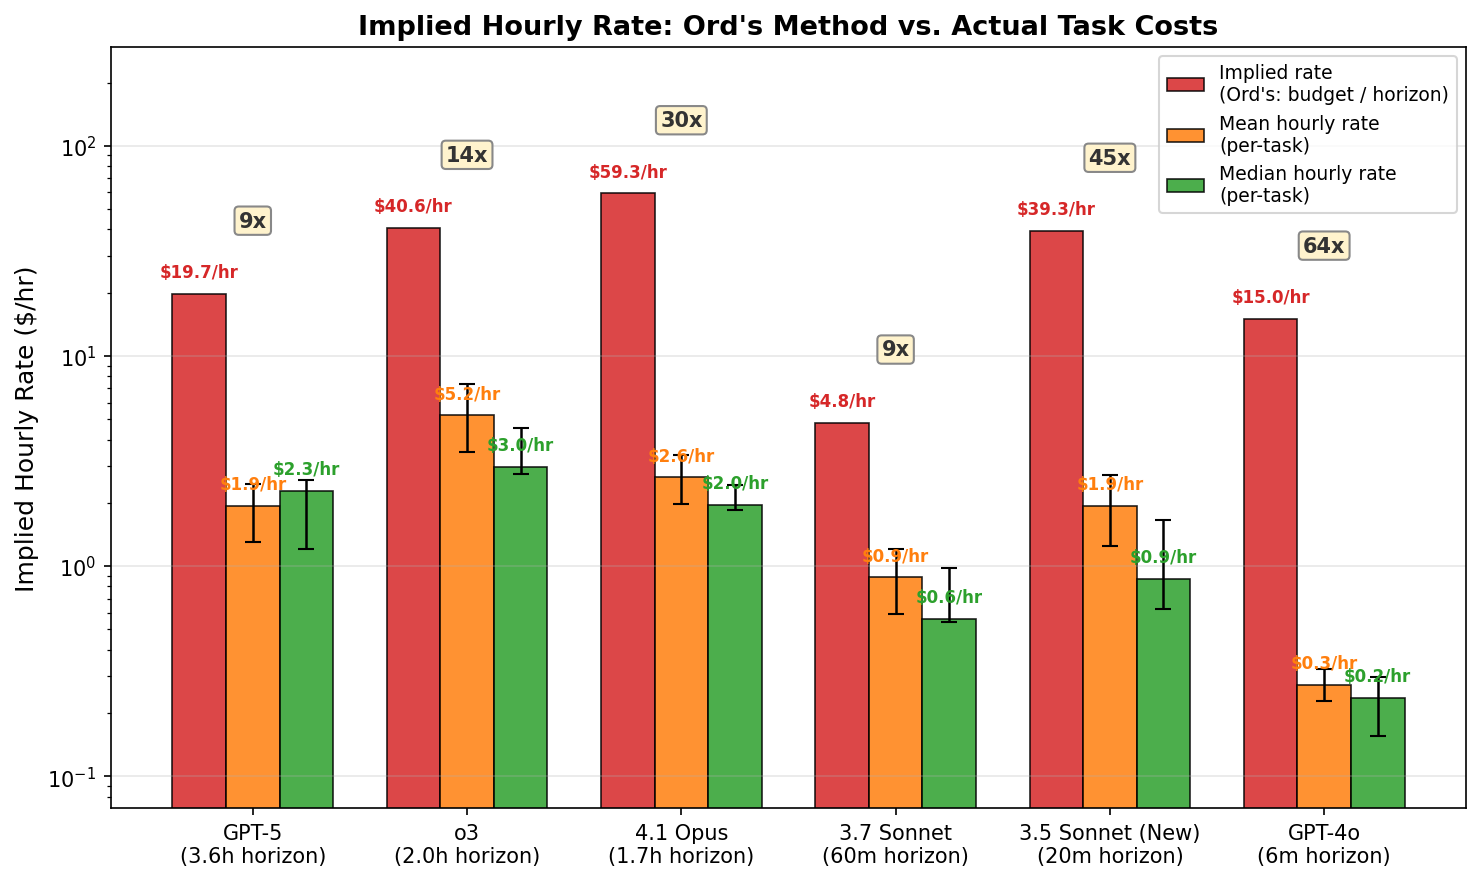
This leads to significant overestimation of absolute costs, possibly by an order of magnitude or more, and it is sufficiently noisy (overestimation from 9x to 64x) that it’s also difficult to draw conclusions about trends.9
I think there are other, more minor reasons to prefer my analysis to Ord’s:
Even if cost ratios are high for very long tasks (far beyond models’ 50% time horizons), companies could choose not to use models for these tasks. The more relevant metric is the cost of tasks at models’ 50% or 80% time horizons, which I show are low in figure 1 and appendix B.
Ord’s finding of an upward trending in cost ratios largely relies on o3 and GPT-5 having higher hourly cost than other models. But in figure A1, the token cost of these models is approximated with the token cost of o1, a particularly expensive model.
Ord’s analysis uses fewer and older models than my analysis, and so may be less reflective of trends.
Appendix B: Additional cost at time horizon graphs
50% time horizon
I show that the overall trend of cost ratio versus time horizon doesn’t depend much on whether I include tasks with time horizons further than the model’s 50% time horizon.
80% time horizon
Including failures
Appendix C: 80% affordable time horizon
For some applications (e.g., physically dangerous or secretive ones), AI might be used to replace humans even if it is more expensive than them. I still think AI labor being expensive would substantially slow adoption in many areas.
For METR’s data, I don’t have exact inference costs for most models, so I estimate cost from each run’s total token count multiplied by the simple average of that model’s per-token input and output prices on OpenRouter. Note that OpenRouter prices can differ from direct API prices (e.g. Claude 3.5 Sonnet is $6/$30 per million tokens on OpenRouter vs $3/$15 on Anthropic’s API). Because the data only records an aggregate token count (no input/output breakdown), this assumes a roughly equal split between input and output tokens. I tested this assumption against a few tasks for which METR recorded the exact cost and found it to be a reasonable approximation. Pricing was not available on OpenRouter for a few models: for Claude 3 Opus I used Anthropic’s historical API pricing, for o1-preview and Claude 3.5 Sonnet (Old) I substituted pricing from their current-generation equivalents (o1 and Claude 3.5 Sonnet (New), respectively). Some runs for GPT-4 0314 and o1-preview lack token counts and are excluded from the cost analysis.
The overall shape of the graph isn’t very sensitive to this parameter. I show this in Appendix B.
Failed attempts are harder to interpret, since a failure doesn't tell us how many tokens would have been needed to succeed, but the absence of any upward trend even with failures included suggests selection isn't masking rising costs.
I exclude tasks under 1 minute 30 seconds because they are predominantly run on a different scaffold (swaa/generate) that is less comparable to the agentic scaffolds used for longer tasks. I also do this for figures 3 and 4.
I tried many fits, and the logistic had the best accuracy on withheld datapoints.
To avoid selection effects, one might compare models only on tasks they all complete successfully. But weak models only complete very short tasks, so this would only tell us about costs on 5-minute tasks. I'm instead interested in costs at the frontier of each model's capabilities.
Thanks to Gordon Seidoh Worley for this observation. From their comment.
Ord also calculates “sweet spots”, where models are maximally cost-effective, using a similar methodology. Although the effect might be smaller, I suspect something similar would apply to the sweet spot analysis, because Ord’s method still inflates costs at shorter time horizons.
Very cool! I very shallowly did a similar analysis inside METR with similar results but never found the time to publish it. I'm glad I can link to yours.
Great work! This nontrivially updated me toward faster timelines. Though, I think there might be a little more to the eval overfitting argument.
Overfitting plausibly disproportionately reduces costs at longer time horizons. The cost of applying “memorized solutions” or, more realistically, “techniques that look similar to training data” could be more slowly increasing in task difficulty than the cost of more novel reasoning. So overfitting gives a bigger relative cost discount on harder tasks. This might be especially true if companies are specifically targeting the current eval frontier.
This connects to a broader bearish argument: that current impressive performance is largely explained by how far the training manifold stretches, not how far models reason off of it. I personally come down closer to the bull side. Most economically and scientifically relevant tasks are probably close enough to some kind of training data, and humans don't generalize that far from their own "training manifold" either.
Various evals have attempted to get at this (the different ARC-AGI ones come to mind) but the fact that they still eventually get hill-climbed by these "pattern-matching" machines is evidence that a lot of "off-distribution" tasks can be solved by rearrangements of on-distribution learned building blocks (especially with reasoning models). That said, I do think if you put a lot of interleaving novel concepts into the context window, you can throw current systems off relative to how impressive they seem working with concepts that appear a lot on the internet.
Where I think the bear case is stronger is software-only intelligence explosion dynamics specifically. The tasks that matter for recursive AI R&D improvement might start close to some kind of training data but involve increasingly more novel reasoning as low-hanging fruit is picked and getting more AI R&D-relevant data from experiments becomes compute-constrained. Maybe models just fail rather than succeed expensively, and those failures wouldn't show up in cost ratio data at all.